

Flooding
by John Shribbs, 2021

This lithograph shows Sacramento underwater during the California floods of 1861-62. Link to article
Flooding has occurred many times in Petaluma
The Petaluma Valley is a relatively flat alluvial plain developed by overlapping and coalescing alluvial fans derived from the erosion of volcanic rocks in the bordering highlands. This alluvium is comprised of clays, silts, and floodplain sediments, with minor layers of sand and pebble gravels. The elevation ranges from sea level (National Geodetic Vertical Datum of 1929) at the Petaluma River to over 400 ft. in the surrounding hills. Through the years, growth has resulted in encroachment upon many segments of the waterways and floodplains in the urban area.
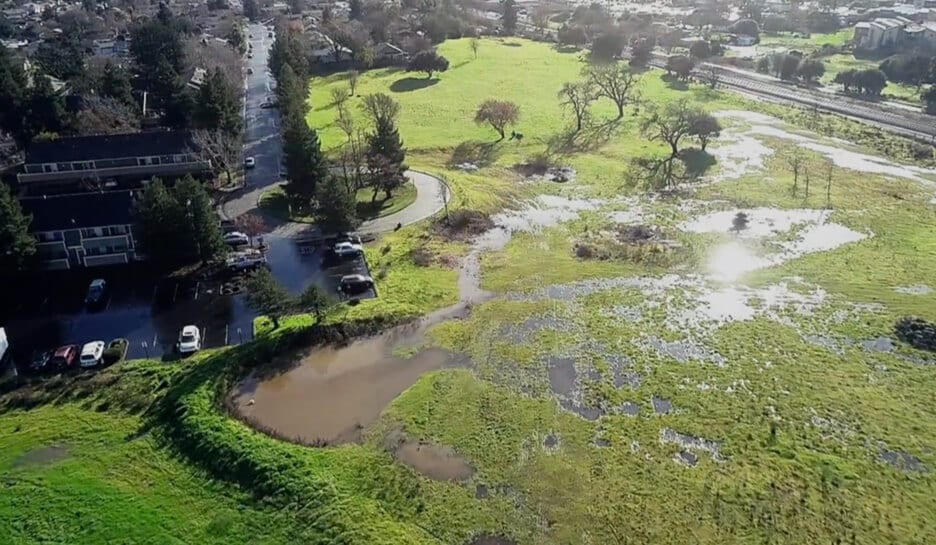
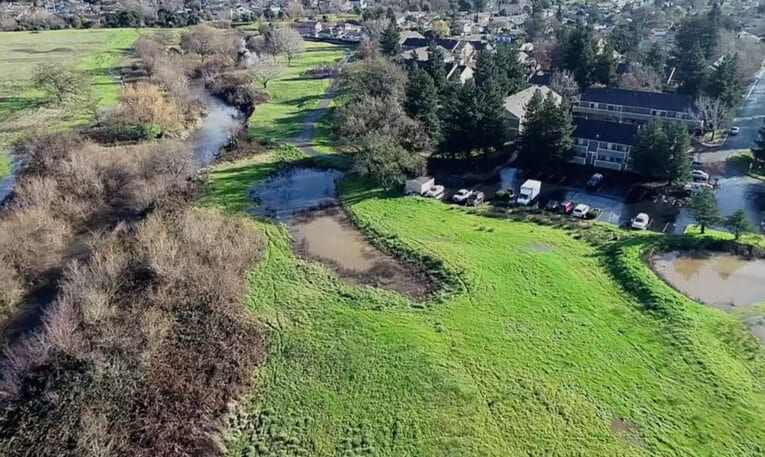
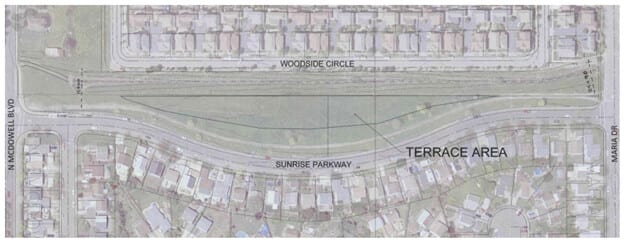
The area below is slated for a new housing development which will be at risk, but the city supports this type of infill to meet housing needs based on State required mandates for expanding low-income housing.
The downtown area flooded many times in the past. Floods in the Petaluma River Basin are normally of short duration, lasting 3 to 4 days, or less. Tributaries of the Petaluma River can begin to rise within hours after a heavy storm event has begun if the antecedent soil moisture content is already high. Typically floods occur between December and March. Flooding has taken place in the City, to the extent that at least some street flooding occurs, on average once per year over the past twenty or so years. Recent significant flooding events (meaning street and property flooding) have occurred in Petaluma in 1982, 1983, 1986, 1995, 1996, 1998, and 2005. The largest flood of record in the City of Petaluma occurred from January 3 through 5, 1982, and caused an estimated 28 million dollars in damages. A significant flood event occurred on December 30-31, 2005, over-taxing both piped and open channel systems.
In the mid-1800’s stormwater runoff from the Petaluma watershed, which drained to the Petaluma River and its tributaries, often overtopped the existing channels and spread across the valley until it could return to the waterways and complete its flow to San Pablo Bay. In the ensuing century, with the settlement of the town of Petaluma and the surrounding areas, and the urbanization of the region since the 1950s, such overflow could no longer be tolerated. Measures were implemented to improve drainage and control the flooding — flood control projects were constructed, standards were adopted for private development, and floodplain zoning was instituted. In the 1970s the entire eastside, which was an alluvial flood plain and historic wetland, was developed into a suburb of houses, and creeks were confined to nearly straight flood channels from the lower parts of the hills to the river. All of these helped to solve many of the problems, but many problems still exist. The most serious of these is the flooding that occurs along the Petaluma River itself. This waterway, which once meandered across the valley, now flows through the most heavily urbanized area of the City and causes significant damage and disruption when storm runoff from its tributary area exceeds its capacity.
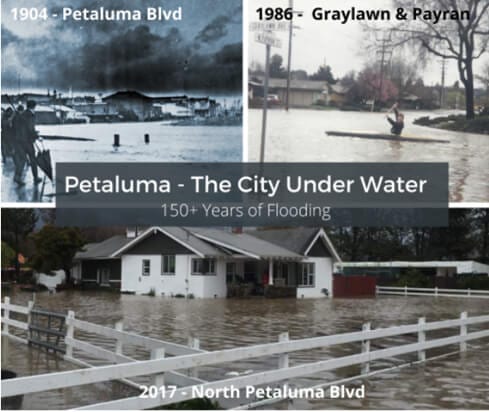
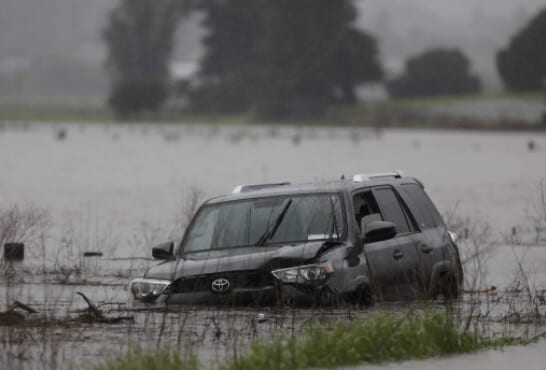
Three major flood events. Photo from Take Action Petaluma:
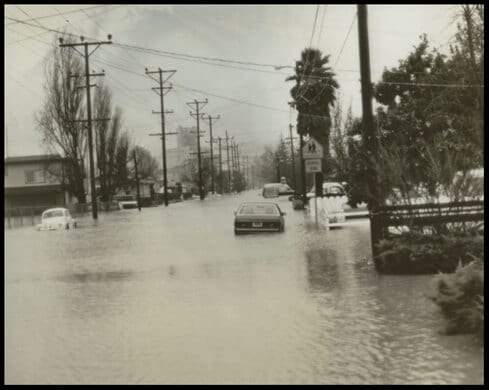
Flood 1965 on Madison St. Courtesy of Sonoma County Library.
On March 9, 1995, Petaluma once again experienced significant flooding. This flooding resulted in approximately nine thousand dollars of damage to the Petaluma Wastewater Treatment plant when fencing and levees around an aerated lagoon were damaged. There was additional damage to Hopper Street, as well as an increased need for electricity usage and monitoring.
In the winter of 1997-1998, the effects of El Nino storms were felt throughout California and the rest of the country. Some large storms hit the West Coast in the first three weeks of February 1998, and these caused flooding in Petaluma as well as in many other parts of the state. The cost of damages in Petaluma was nearly six million dollars.
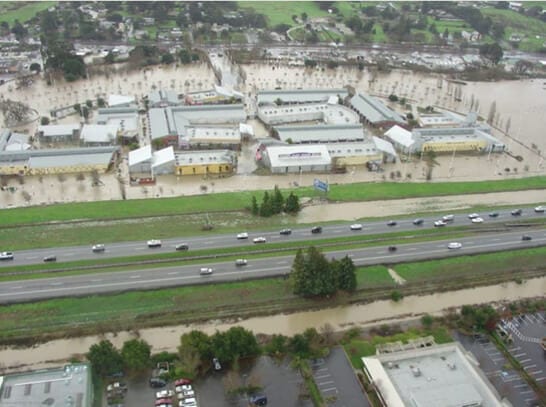
On December 31, 2005, the City experienced significant flooding, particularly in the middle and northern areas of town. It is estimated that approximately 53 structures, not including mobile home parks, were damaged by floodwaters at an approximate cost of $56,000,000.
Outlet Mall 2005. From City of Petaluma Floodplain Management Plan October 2015.
During the December 11, 2014 flood event, several commercial, industrial, and Auto Dealership buildings were inaccessible because of flooded roadways surrounding the Industrial Avenue area.
Flood on Stony Point Rd. 2019. From Take Action Petaluma.
Climate Change should be renamed Hydrologic Cycle Disruption since our water cycle in wild fluctuations will be both a cause and result of the warming earth. Ocean water captures and holds a great deal of heat energy and atmospheric water transfers this energy around the globe. Larger storms are occurring more frequently, and their impact is felt across the county.
Development on the river edges is prone to flood. The housing development area below is next to the river which is at risk of periodic flooding.
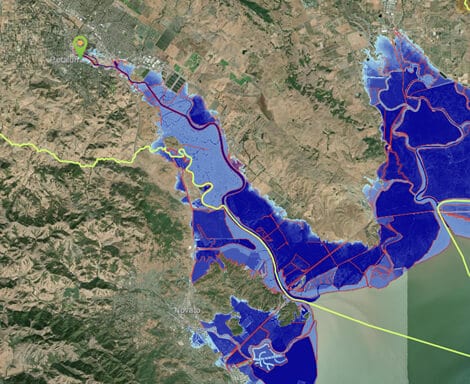
The current risk of flooding and future flooding with rising sea level is illustrated by looking at an interactive flood map Adapting to Rising Tides Bay Shoreline Flood Explorer website found online here. This map of Petaluma shows water level with a 3-foot rise in sea level and 25-year storm, expected by mid-century:
The following map shows a similar situation for the marsh. The red lines are dikes that will be overtopped with water filling in areas behind. Many of the agricultural lands near the mouth of the river have subsided (reduced in elevation) and are the most threatened area for flooding.
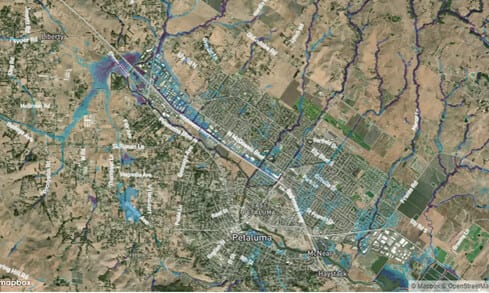
This map shows potential flooding in Petaluma during a major storm (5% probability) if the many adaptations we have done over recent history fail. Image from Floodfactor, available online here.
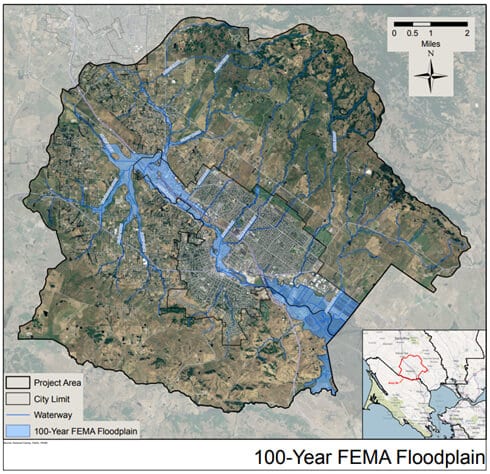
Approximately 1612 acres of the City of Petaluma lie within the FEMA designated 100- year Special Flood Hazard Area (SFHA), shown in the map below. In addition, 112 acres of this area are a designated floodway.
Flooding also depends on the rate of flow out through the river/slough and marsh. The buildup of sediment reduces the size of the channel. Larger storms in the future with rising sea levels combined with King Tides will only increase flooding potential in the future.
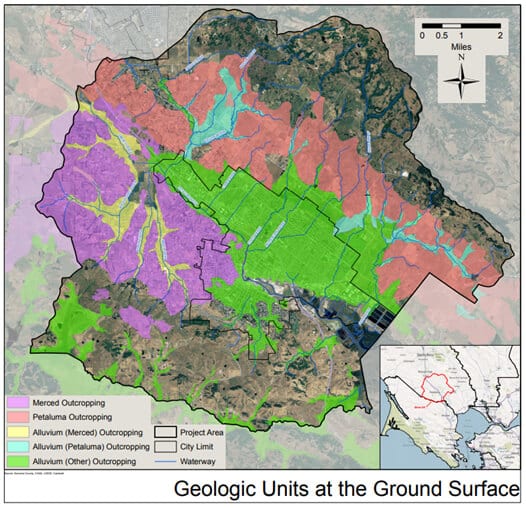
The following map shows that much of Petaluma is an alluvial plain with highly erodible rocks and soils on the eastside hills and much of east Petaluma was a historic wetland area.
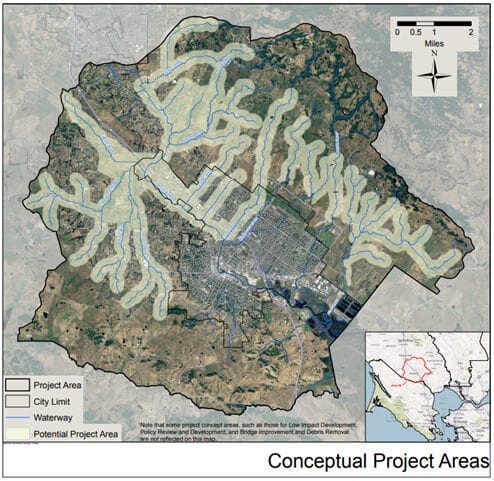
The following map shows areas of flood management projects.
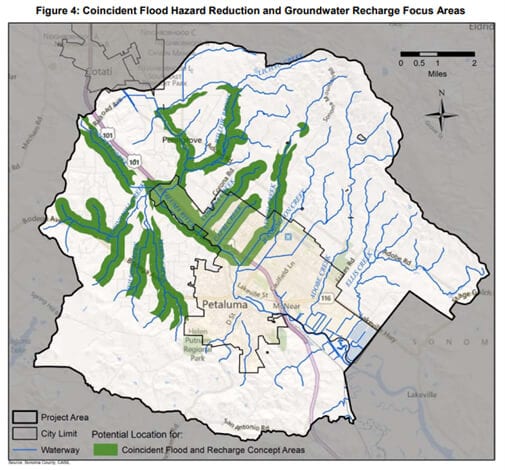
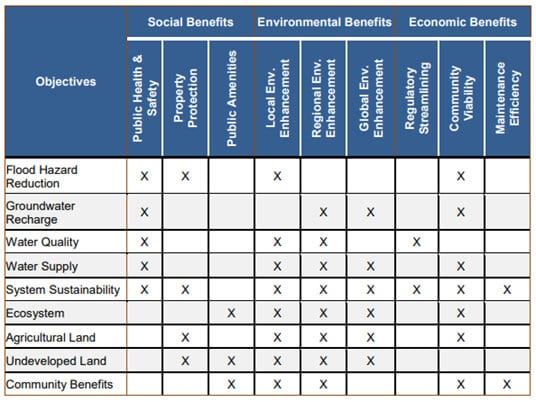
One of the major concepts presented was that flood management projects can be combined with groundwater recharge.
Using Nature-Based Solutions
Restoring wetlands and alluvial plains will help reduce the risk of flooding. Also, reducing sediment outflow to the river with catch basins, vegetation buffers, and expanding setbacks will help reduce flood potential. Trees absorb over 30% of initial steady rain and this also reduces erosion and flooding.
A flood plan developed for Petaluma over 10 years ago set up criteria to evaluate the best investment strategies for flood management actions.
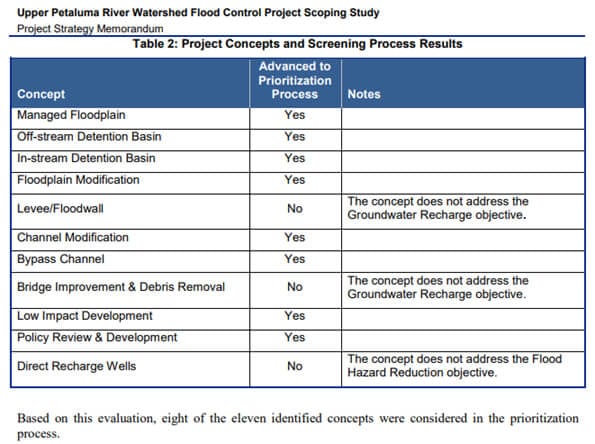
Eleven project concepts were identified and the concepts are:
- Managed floodplain – Floodplain project concept that maintains existing floodplains in their current condition to preserve existing flood protection benefits.
- Off-stream detention basin – Off-stream project concept that temporarily stores excess floodwaters and reduces downstream peak flows.
- In-stream detention basin – In-stream project concept that temporarily stores excess floodwaters and reduces downstream peak flows
- Floodplain modification – The floodplain project concept that increases the storage capacity of existing floodplains and triggers the use of the floodplain more frequently.
- Levee/floodwall – Top of bank project concept that reduces floodplain area by creating a barrier to flood flows.
- Channel modification – In-stream project concept that increases the carrying capacity of the waterway.
- Bypass channel – Off-stream project concept that provides a parallel flow path to an existing waterway, thus increasing the overall capacity of the reach.
- Bridge improvement and debris removal – In-stream project concept that reviews and improves the flow approach to bridges and removes existing debris caught at the bridges.
- Low impact development – Off-stream project concept that is not directly connected with the waterway, but reduces runoff that would otherwise lead to increased flow.
- Policy review and development – Non-construction project concept that examines and potentially supplements existing policies impacting flood hazard reduction and groundwater recharge.
- Direct recharge wells – Off-stream project concept that uses wells to recharge aquifers with stormwater.
The matrix below outlines benefits expected to be realized by pursuing each of the project objectives.
Table 2: Benefits Associated with Objectives
A later report from 2015 lists these concepts and criteria that need further study:
- Hydraulic modeling – Hydraulic modeling would confirm those project concepts would provide flood hazard reduction benefits while meeting minimum environmental standards and generate other useful information, including the ability to recharge groundwater through percolation.
- Geomorphologic studies – An understanding of the current and potential future geomorphology (the physical features of potential sites) would allow the Water Agency to better design projects that could reduce sediment deposition in streams and help prevent erosion.
- Geologic fieldwork – Based on available geologic mapping, there are limited locations for the recharge that would improve water supply reliability in the project areas. By testing soils, scientists and engineers are able to classify materials and identify whether projects in that area could be expected to provide recharge.
- Habitat and endangered species evaluation – As specific project areas are identified, an evaluation of local habitat and species of concern can take place.
- Water quality sampling – Surface water and groundwater sampling would likely be necessary to better understand the potential benefits and impacts to existing resources and assess a specific project’s potential to dilute or mobilize contaminants.
- Land ownership and easement identification – Understanding which properties are public, which are privately held, and which have existing easements that could limit the application of project concepts is important to identifying feasible locations for projects
- Cost and benefit analysis – Costs associated with specific alternatives, as opposed to the concepts developed in the Scoping Study, will be developed. The financial, environmental, and social benefits will also be evaluated for comparison to the alternative cost.
The recommended tiers for concept prioritization are:
- First Tier
- Floodplain modification
- Off-stream detention basin (surface)
- Second Tier
- Channel modification
- Bypass channel (surface)
- Third Tier
- Off-stream detention basin (buried)
- Bypass channel (buried)
- In-stream detention basin
- Enhancement Tier
- Managed floodplain
- Low impact development
- Policy review and development
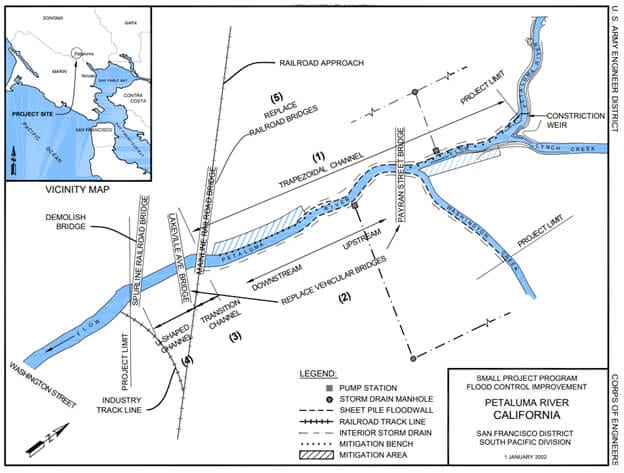
The Payran-Lakeville Flood Basin Project was a result of this effort. Work on the project began in 1988, following an unusually powerful storm in 1982 that caused $28 million in flood-related damage. A smaller storm in 1986 still caused $1 million in damage, prompting the city to seek federal aid to improve its flood control infrastructure in the area.
Spanning north from Lakeville Street, the project included the installation of hundreds of feet of floodwalls, two new emergency pumping stations, replacement of the Payran and Lakeville Street bridges, construction of a new rail bridge, and the reshaping of the channel east to Lynch Creek. Costs were shared between federal and local funds.
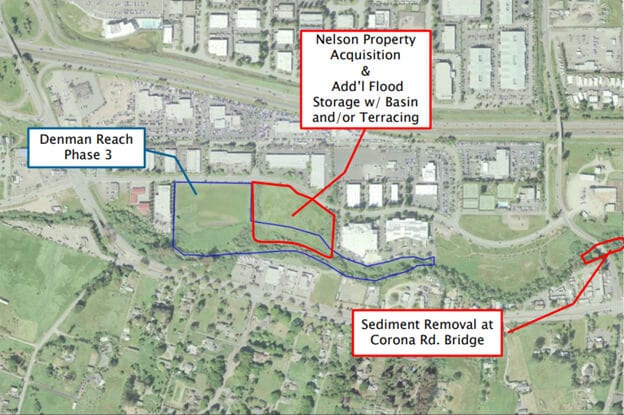
Another project, Denman Reach, located on the Petaluma River north of Corona Rd., will provide additional flood protection, enhance riparian habitat, and manage sediment. Key elements: acquire flood-prone parcel for flood management, install riparian vegetation, and remove sediment under Corona Road bridge crossing area to improve floodwater carrying capacity. The natural storage area of Denman Flat in the northwestern part of the City, where Willow Brook, Liberty, Marin, and Wiggins Creeks come together to form the Petaluma River, acts as a retention basin, and helps to reduce downstream peak discharges.
The Capri Creek Flood Control and Habitat Enhancement Project were also completed.
Other projects are being planned at Corona Creek Reach, Kelly Creek, and Washington Creek according to a 2018 report: Zone 2A Project Updates, available online here.
Floods are still coming our way, so we need to take further steps. The city and county are both working on this issue in a continuing effort. The city utilizes a surface water management model (XP-SWMM) as a tool to provide hydrologic and hydraulic solutions for the Petaluma watershed.
References and Sources of Material Used:
City of Petaluma Floodplain Management Plan October 2015.